People conduct interviews in research to gather in-depth, qualitative insights directly from participants. Interviews allow researchers to explore experiences, opinions, and motivations in detail, providing richer context than surveys or numerical data. They enable flexibility, allowing follow-up questions for deeper understanding. Additionally, interviews help capture nuances, emotions, and personal perspectives, making them valuable for studies in the commercial sector, social sciences, healthcare, business, and anywhere where you need to find out how people experience your product or service.
Pros & Cons of Interviews
Interviews are a valuable research tool, providing rich, qualitative data that helps uncover emergent theories, build relationships, and gain a deeper understanding of a topic or community. They offer a way to grasp the bigger picture and lay the groundwork for effective change. However, interviews can be time-consuming, resource-intensive, and expensive, with challenges such as participant reluctance, interviewer bias, and the need for specialised training in thematic coding and analysis. SenseMaker® is a smarter way to capture real experiences and enjoy all the benefits of real interview-led research without the associated time, training and energy costs all while reducing the risk of bias.
Read on to learn more about the benefits of SenseMaker®, or skip ahead to the table comparing SenseMaker® versus Traditional Interviews.
SenseMaker® isn’t just another survey tool – it’s a revolution in how we gather real-life experiences. Instead of rigid questions and rehearsed answers, SenseMaker® allows people to share their own stories in their own words. Using predefined labels, respondents categorise their own experiences, making analysis faster, more accurate, and free from interviewer bias.
SenseMaker® is a Smarter Way to Capture Experiences because
With digital access via mobile apps and online surveys, SenseMaker® reaches a wider audience than traditional interviews ever could. The anonymity and convenience encourage openness – no more polite or pressured responses. Instead, you get insights straight from the source.
SenseMaker® is a Large-Scale & Accessible Data Collection Tool that
Traditional interviews rely on note-taking, transcription, and interviewer interpretation—all of which introduce bias and risk losing key details. Interviewers may unintentionally influence responses, shaping narratives instead of capturing them. SenseMaker® removes the middleman, letting respondents frame their own experiences in ways that truly reflect their perspectives.
By using structured signifiers, SenseMaker® ensures responses are categorised consistently. No more sifting through transcripts and guessing themes – patterns emerge naturally, giving you richer, more reliable insights without the hassle.
So Why is SenseMaker® more reliable than Traditional Interviews?
Traditional interviews require painstaking manual coding and subjective interpretation. SenseMaker® streamlines this process by automatically identifying themes, emotional tones, and shared experiences across large datasets. Decision-makers get actionable insights faster, with a clearer understanding of emerging trends and potential challenges.
If you Analyse Themes & Patterns with SenseMaker® you get
Forget messy filing systems and endless spreadsheets. SenseMaker’s digital platform stores every response in an organised, searchable format. Built-in visualisation tools generate charts, graphs, and reports with a click – so you can present findings clearly without spending hours formatting data.
Easy Storage & Instant Visualisation with SenseMaker® includes
More authentic stories. More accurate insights. Less bias. Less manual work. If you’re still relying on traditional interviews, it’s time to upgrade. SenseMaker® delivers deeper understanding and actionable intelligence – faster and more efficiently than ever before.
Feature | SenseMaker | Traditional Interviews |
---|---|---|
Primary Purpose | Identifies patterns in narratives through participant self-interpretation. Your theories can be tested against what the data is showing. | Varies. Typically develops theories inductively from gathering qualitative data. |
Approach | Combines qualitative and quantitative analysis by using structured signifiers (Triads, Dyads, etc.). | Purely qualitative and exploratory; may include iterative coding of data if the interviewer has received training. |
Data Collection Process | Participants submit self-signified narratives via structured digital tools. | Researchers conduct interviews and may also make observations and take field notes. |
Type of Data Collected | Short narratives, micro-stories, and structured responses. | Interviews which will vary in degrees of structure. Some interviewing processes will allow open-ended responses and allow observations by the interviewer. |
Sample Size | Scalable (hundreds or thousands of responses). | Smaller samples due to time/resource cost. |
Speed of Analysis | Fast (automated dashboards & self-signification). | Slow (manual writing, interpretation, and analysis). |
How Data is Analysed | Pattern detection through visual dashboards, heatmaps, and statistical tests. Automated coding via Triads & Dyads. | Either through informal methods or the interviewer can receive training in manual coding processes through thematic coding (open, axial, selective coding). |
Statistical & Visual Analysis | Automatically generated heatmaps, cobweb diagrams, word clouds, cross-data correlations. All downloadable as graphics. | Analysis must be done manually by a trained interviewer, for example, manual thematic clustering, memos, and comparison. |
Bias Reduction | Minimises researcher bias by having respondents interpret their own stories. | Higher risk of bias, as the researcher codes and interprets responses. |
Role of Interviewer | Minimal intervention; participants categorise their data. | Interviewer-driven. Formal training in coding and categorisation is required for theme analysis to be effective. Coding needs to be done extensively by hand. |
Output | Identifies patterns, clusters, and trends in narratives – allowing you to focus on generating theories of change. | Interviewers generate theories based on emerging patterns in data. Data collection risks being biased or even incomplete leading to premature decision making. |
Survey Tools | Triads, Dyads, Open-text, Image-based prompts. | Interviews, focus groups, and field notes. |
Scalability | Can process large volumes of responses. | Typically not scalable. High time and resource cos, so best for small studies. Requires significant expertise and cross-checking. |
Cost | A single cost that is fixed no matter how much data you collect, the price for a 3 month NFP licence: i.e £900 only | Varies. Can be difficult to predict ahead of time. The time cost of the analysis stage can increase exponentially with the amount of data you collect. |
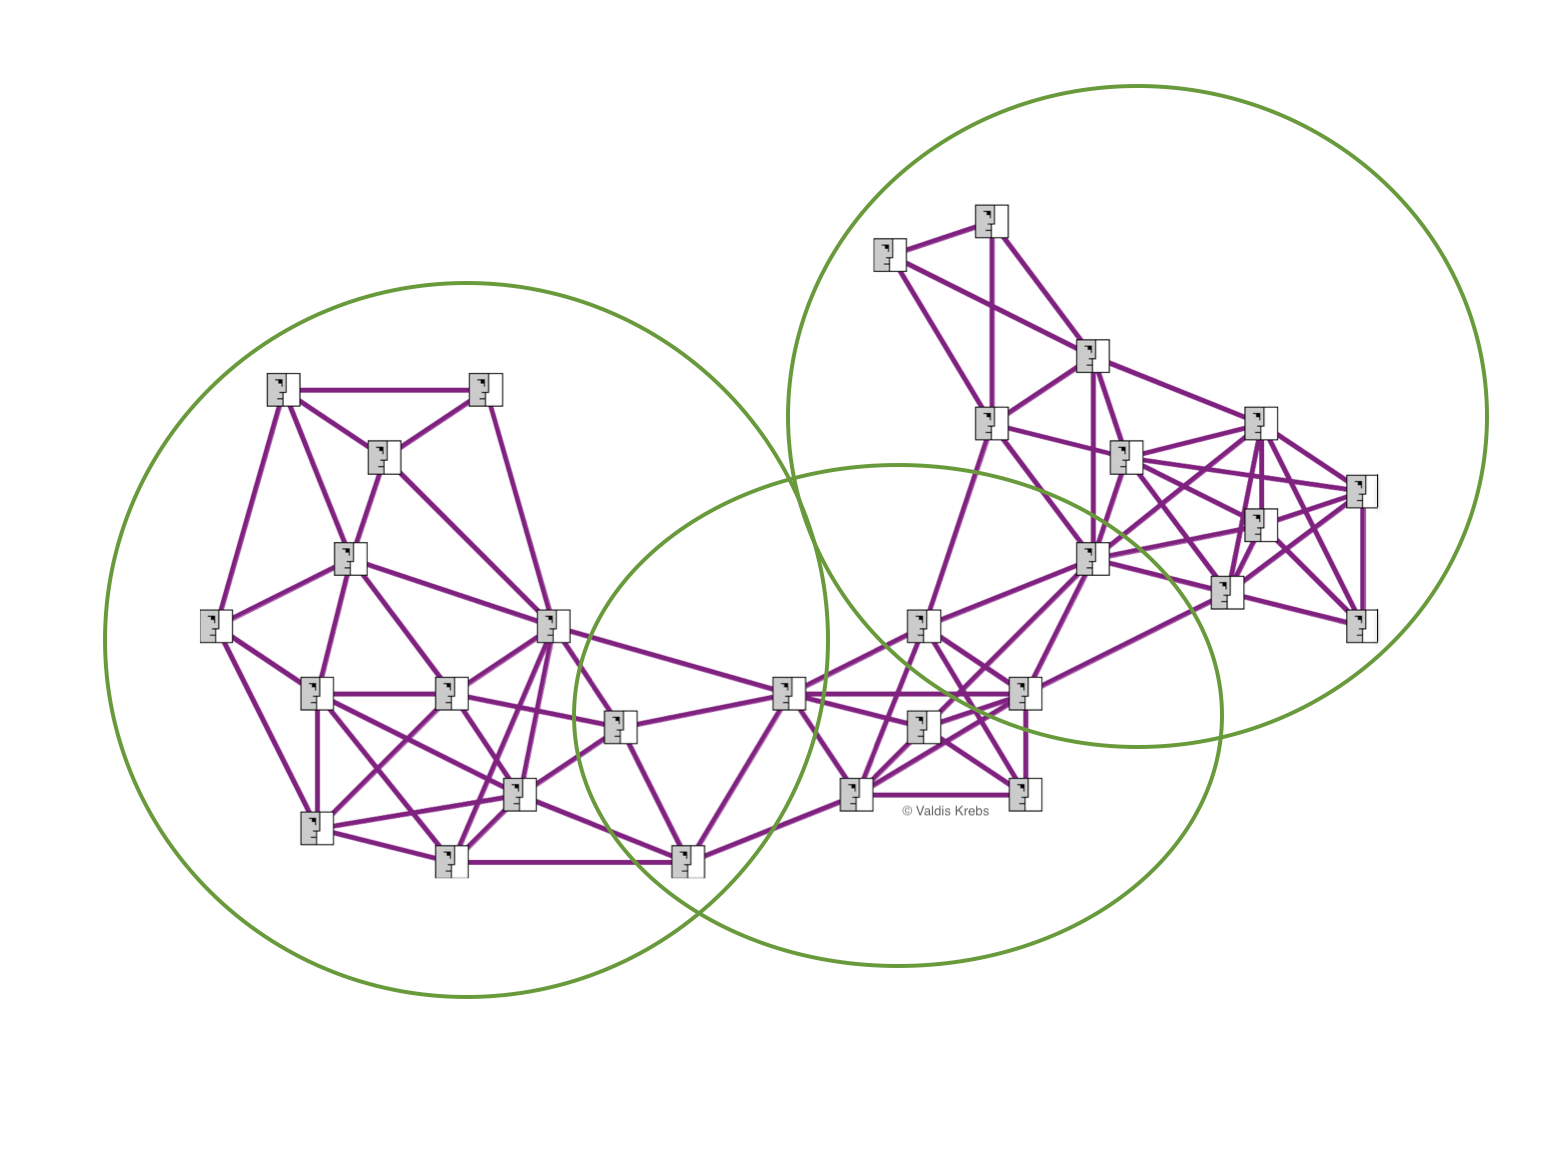
It is funny, when we think about networks, we think about groups, communities, systems, and other complex collections of interacting entities. Yet, the most popular social network metrics are “individual centralities”! Who is the most connected? Who is the best connected? Who is the hub? Who is the influencer? Who spans the most structural holes in the network? We are looking at complex interconnected systems yet we are focusing on individuals. Does this make sense?
People playing key roles in organizations and communities are important, but not for what they do for themselves! They are important for how they weave the network — what they do for the whole community. From our 25+ years of network consulting with medium to large communities and organizations we have never seen a successful entity run by a few highly central actors. The opposite is also true — we have never seen a successful entity of any size that has perfectly distributed centrality — everyone has the same or just about the same number of connections. Connections in human networks are unevenly distributed, but the distribution is not extreme like in a man-made network with a handful of hubs and many, many spokes. A hub-and-spoke network is great design if what flows in the network is distributed by clear rules of law and/or physics, like electricity. Human affairs, involving agency of each connected node, are not easily handled by simple networks. We live in complex interconnected clustered networks (a.k.a. small-world networks in core-peripehry structures) where common physics fails to work. Self organization and emergence matter more than simple rules and methods.
If not the influencers and hubs in the network, then who and what matters in our human networks? It is not those that stick out, but those that help us stick together — they are the key roles in our self-organizing networks!
It is not those that stick out, but those that help us stick together !
Let’s look at an emergent network from one of our clients. It is made up of 4 groups. These groups could be departments, projects, product teams, task forces, etc. In this situation they were various project teams working on products and services for a common customer. In Figure 1, we see the four project teams — each with it’s own color. The nodes are employees, and the links show who regularly works with whom on a variety of tasks.
Figure 1 – Four Project Teams
The key to this organization’s success was not only how well each project team collaborated internally, but how all four teams worked together. No matter how well they each worked separately, it was the connected effort that mattered. It was the connected effort that built the right solution for their customer. Figure 2 shows us how each project team was connected to other project teams.
Figure 2 – Four Connected Teams
The people connecting the teams are seen as boundary-spanners — bridging one team with another. The key boundary spanners are shown as larger nodes in Figure 3 below. The boundary spanners bridge their team with the other teams by having sufficient connections with their own group and with the other groups. It is through these connections that knowledge, experience, news, and know-how can travel when needed or when requested.
Figure 3 – Bridging Boundary Spanners
A few of the boundary spanners are nodes with high centrality in the network — most are not. Yet all boundary spanners play a very important role in the organization. Without bridging connections the organization would only function well on the Ordered Side of the Cynefin framework (covering Simple/Obvious and Complicated).
Instead of focusing on a few individuals, maybe we focus on the patterns of relationships, flows, and interactions in our complex human systems? What does emergence tell us? It is not the centrality of a few that matters, it is the weaving of many that is key to a successful community or organization!
To discuss this case further, and other topics on networks and complexity, please join us for the upcoming Exploratory from Feb 10, 2021 through March 10, 2021 with weekly sessions.
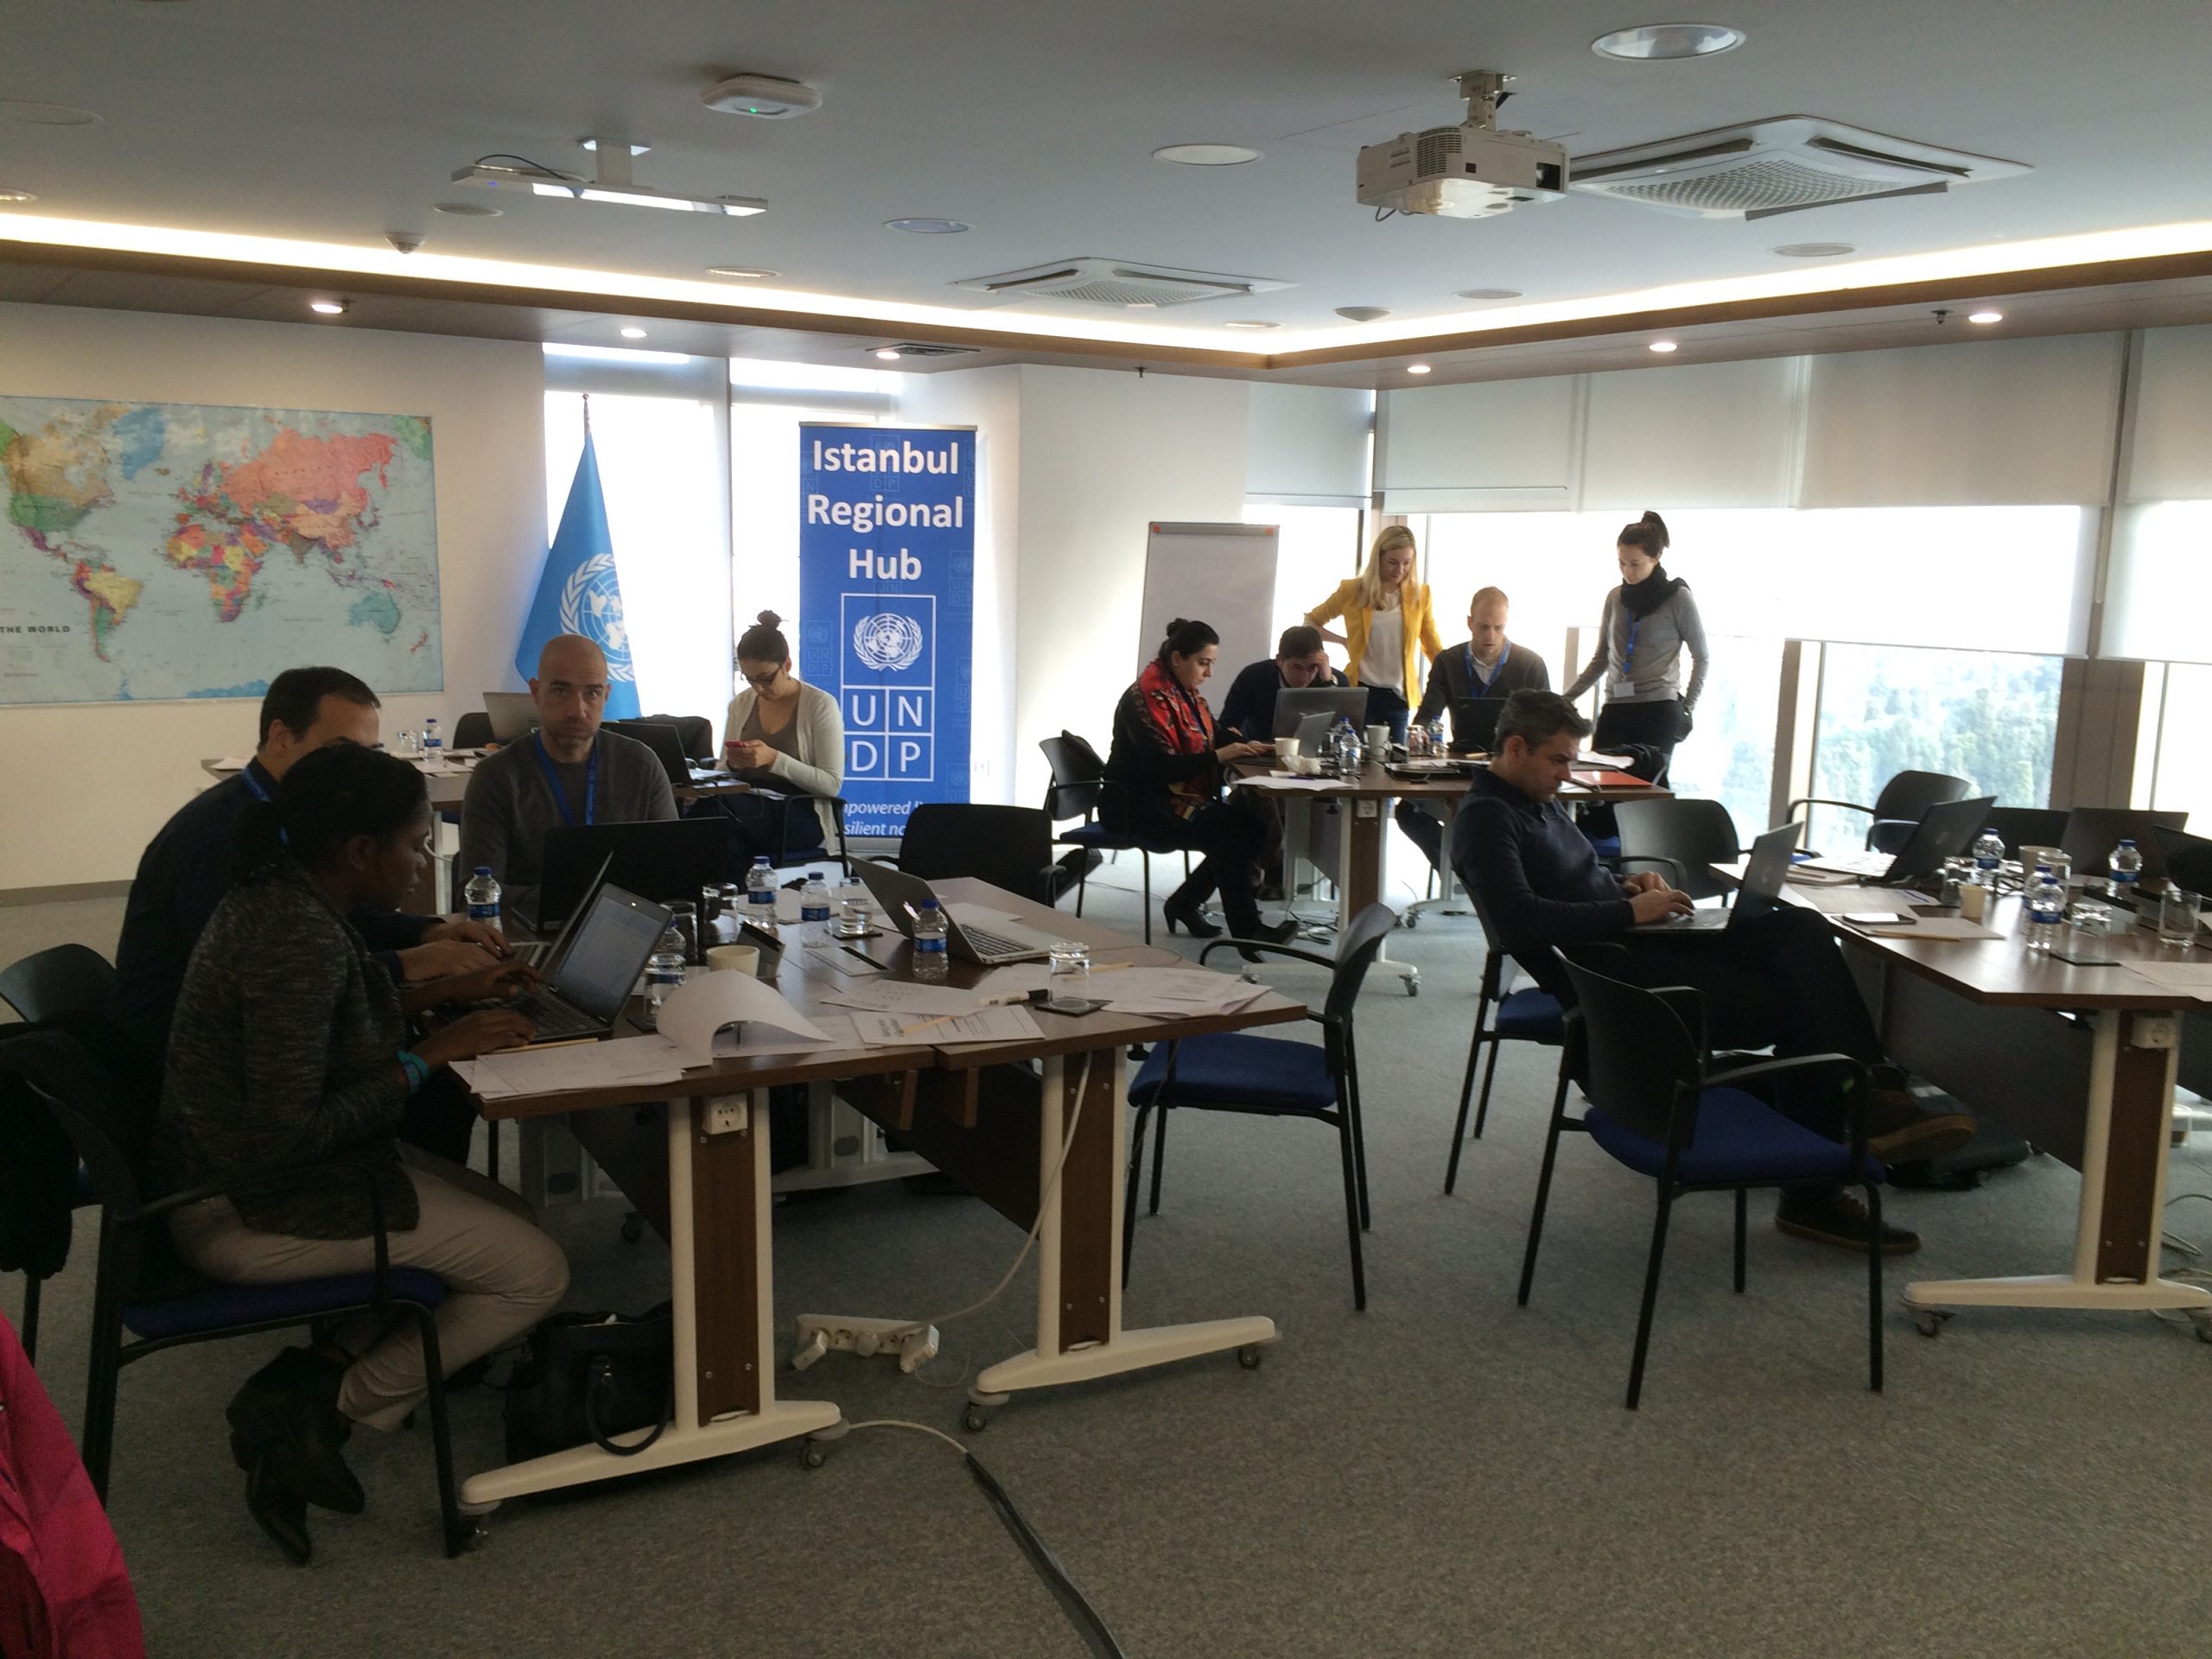
Back in June 2015, we began the Fragments of Impact programme, partnering with UNDP, to explore how to use SenseMaker® in monitoring and evaluation. This week we’re back in Istanbul, with all the various participants to teach and explore the data and what to do next – in terms of interventions, in terms of monitoring and in terms of advocacy.
The programme, open to any NGO organisation, was joined by UNDP teams, the International Labour Organisation (ILO), VECO and UNICEF. (Next time, I hope we’ll see more smaller NGOs joining, but one step at a time.) At our initial June event in Istanbul, we spent a couple of days going through the theoretical underpinnings of why we need to do different things in complex situations, what would be more useful to decision-makers and implementers and what are the necessary elements of running SenseMaker® projects. Working with all the different groups and agendas, we identified three core subjects for research – security and stabilisation; business networks and innovation; youth, poverty and unemployment. And ten different countries that we would be running these in. Exciting stuff.
Immediately after the kickoff, a number of things started to happen:
By September, things were moving – different paces in different places, but moving all the same.
The frameworks were debated and discussed – Anna and I hadn’t quite managed to encapsulate everything, so we decided to build a fourth framework – valuechain exploration. And some countries needed specific extra questions – which brought in the biggest challenge: coordinating frameworks, websites and apps, as Richard Hare, designer extraordinaire, stepped in to start building sites. In fairness, we’d underestimated the time and effort this would take – a useful lesson for next time.
Once the frameworks were finalised, country teams translated the research instruments into whatever languages were necessary – Arabic, Russian, Serb, Bemba, Romanian, Turkish. And the websites were built to match.
Meanwhile, some countries were already starting on collection – in Yemen, paper data was collected in seriously difficult environments. The project lead was cycling to the office at one point, and had to scramble for cover as drones and bombs put in an appearance. Despite all this, they rapidly gathered over 1,000 micro-narratives.
As websites were completed and signed off, collection kicked in big time. Android tablets, iPhones and websites were used to collect directly from people wherever possible. (For Yemen, those papers needed to be entered…)
At this point, the regular calls that Khatuna was holding proved invaluable – sharing knowledge across projects, getting advice on collection problems and more. As you’d expect, some cultures are more open to people collecting information than others – the cross-fertilisation of ideas can be extremely helpful. Bumps in the road are easier to deal with when you talk to someone who’s already further down the road!
So – 26-28 January 2016 finds us back in Istanbul learning about how to explore the data, come up with insights, change people’s perceptions, design and monitor the next interventions.
At this point, we’ve worked with smart, inspiring colleagues in Kyrgyzstan, Moldova, Yemen, Serbia, Bosnia & Herzegovina, Turkey, Zambia, Peru and Ecuador. And the plan is to write up papers on the experiences – and more. Watch this space…
Tag clouds were a popular web visualization fad about 3 years ago. Wordle.net provides a really easy way for you to make and share your own. But rarely is seeing the most frequently-used words in a piece of text very instructive.
Today I figured out how to compare two wordles using python. The difference between two sets of information is far more useful than the information in either text alone. To illustrate, here is an analysis of two rape prevention programs in Nairobi, Kenya.
The Mrembo Program teaches pre-teen girls about boys, sex, and staying healthy in the poor Nairobi neighborhood of Kamukunji. Sita Kimya!, which means “I will not be quiet!” is a USAID-funded program to encourage “young men in Kibera to challenge each other to reject violent behaviors towards women.” — according to USAID. But according to another blog, “Sita Kimya! refers to the vow one should give to not stop yelling if they know sexual abuse is occurring around them.” Which version is right? Maybe these 258 stories collected through the GlobalGiving Storytelling Project will provide a truer view.
Both groups share stories that reflect success and failure, but Mrembo girls are a bit more likely to think of their story as somewhere in between:
[This image was made using SenseMaker(R).]
Here are several more detailed analyses of these programs, and rape in East Africa:
Mapping stories about rape across east Africa
Comparing two rape prevention programs: Mrembo and Sita Kimya
I’ve spent the first part of this week (and the first few days of my guest-blogging – which I’d not put in the diary) at a fascinating event with Dave. There’s nothing quite like a room of diverse perspectives and fierce minds for stimulating your thinking.
As part of the after-dinner entertainment on Monday, Dave talked and I supported with a snapshot of some previous SenseMaker projects – linked around the Children of the World pilots we’ve been running. I’d spent part of the day between sessions revisiting the material we’d gathered in Mexico in particular.
What was encouraging, in revisiting it a year on, was to realise that I’ve become more proficient not just at using SenseMaker itself, but also at digging deeper and interpreting the patterns and results I can see. It can be quite a learning curve and, at times, I’ve wondered whether I was making any progress.
(In the course of the past two years of SenseMaker projects, I’ve realised that looking at other people’s datasets is a lot less illuminating than looking at one that you’ve put together – the signifiers make a lot more sense, you understand the overall context of the data you’ve captured and, eventually, interpretation of results becomes more intuitive and straightforward.)
This week, in the margins of a day full of excellent sessions, I managed to put together a pretty good initial look, along with some notable correlations and insights, taken mostly using Cluster, Distribute and Graph.
From Mexico last year, we had gathered over 1800 micro-narratives prompted by (mostly) ambiguous photographs. The data we’d gathered had been very interesting but of course the fragments were all in Spanish – a language of which I have no knowledge. Looking quickly at the materials, some things jump out as broad-brush conclusions, but it’s also now easy to spot some interesting outliers within it.
For me, there was an added frisson on Monday evening. I’ve done a SenseMaker project on Mexico without ever having been to the country or even researched the country – we relied mostly on the culture-neutral anthropological signifiers that Beth and Dave had put together originally. (For the interested, there’s an in-depth explanation of them here.)
That evening, there were some highly intelligent people in the room who knew Mexico intimately. And there was I, busy reporting back to them on what their culture was like, without ever having been.
It’s a real testament to the power of SenseMaker that not only were there no criticisms, but some extremely passionate people the next day referred back to some of the elements I drew out of the data – elaborating on them, reinforcing the validity of the data and approach we’d taken.
The above picture should give you an example – “How do people deal with difference: Wait it out” dominates the cluster. It’s not been a common response in other countries, so I was prepared for that to be criticised. In fact, people went much further, referring to “Ni modo” – a common Mexican expression/attitude that is difficult to translate into English. It combines elements of “oh well”, a sense of resignation in the face of difficult or trying circumstances.
So – getting better with SenseMaker itself, but also learning even more to trust the results.
One of the hazards of doing research with a broad focus is getting lost in all the information out there. One of the pleasures is just wandering around the internet looking for stuff. Data overload is one of the main reasons I was so grateful to come across the Cynefin framework in late 2006. Apart from this leading later to the opportunity to use SenseMaker™ as research tool, conversations and stories told in doing the accreditation course in Brisbane also led to some exposure to other ways researchers, governments and organisations were using to find important information in big volumes of data.
In 2008 I had my own close encounter with the detailed analysis of text using transcription and NVivo. Learning first-hand how intense and time consuming this approach is drove me to not only make sure I had the opportunity to use SenseMaker™, but also to keep my eye open for other options. It’s not that the results of detailed analysis weren’t valuable, just that the price seemed far too high. I started out looking at semantic analysis and word density tools and stumbled into Latent Semantic Analysis, anti-plagarism software Turnitin and iThenticate and text analytics and I’m still looking.
Plagarism is a big concern in academia and even a simple search on Google will turn up many things that have clearly come from the same place, attributed or not attributed. Churning out words can turn into more than an embarassing slip-up for a professional writer . Stories can echo around the place. I get the feeling that often people are either just too busy or don’t have the skills with the nuances of language to create an original response to something read or heard, it’s easier to just repeat it on just like telegraph did in the 19th century.
Data mining is huge and if you don’t have the technical background it seems a bit like divining for water. It does help if you know the water is there already. Text analytics have been developed for academic purposes and more general use. Examples include tools such as Leximancer and quintura though I am sure there are more (please feel free to comment on any good ones you know about). This post just marks some thoughts on how the options of finding ideas in large volumes of information are evolving.
I was reading today about how Benjamin Franklin received a ‘could improve’ note from his teacher as a young child and was encouraged to teach himself how to write eloquently by reverse engineering a much admired text.
Maybe part of the challenge and part of the solution is that the text and stories that link together big ideas use prose that is well beyond the day to day language people have learned to use. The best explanations make clever use of metaphors and myths to get complex ideas across to others. Part of me does not trust that the hocus pocus of semantics can really find these true gems, many of which I have come across purely through speaking with people, serendipity, rumours and persistence. Which is why I like story and narrative and using naturalistic sensemaking and SenseMaker™.
A big thanks to David Williams who has been the guest blogger since 30th August. Wendy Elford from Canberra here. This first blog in the next stint will skip any real detail on personal history but I will say that both my job roles and interests place me at a halfway point between art and science, and I love to see links made between the two. Being a fan of the post-impressionists (my mother was an artist), I very much enjoyed reading David Williams’ last post with the image of Georges Seurat’s ‘The Side Show’. It’s easy to make the connection between the science of the image – the deliberate colour variation and the number of strokes – and the value of the image as art. Seurat was very clear that “They see poetry in what I have done. No. I apply my method, and that is all there is to it.” The trompe de l’oeil is created partly by Seurat’s method and partly by being able to gain a distant perspective, a perspective which SenseMaker™ achieves with narrative.
Moving on from this, perspective shift and patterns are two of my favourite ideas (no doubt shared by many in the Cognitive Edge community) so I thought that I would share examples I’ve been collecting. I’m guessing that the TED talks might be familiar to some of you. One in particular by Blaise Aguera Y Arcas blew me away when I first saw it in 2007. Photosynth can create a composite image in three dimensions from thousands of photos. Even though the technology has now been around for a few years. Photosynth is still impressive and I’ve been looking to see what has come of it. I found several examples, this one just serves to reinforce David Williams’ point about the number of perspectives needed to build the picture.
Here is another snapshot of other forms of data visualisation and sonification. You can spend many hours on the internet finding more examples – it really is entertaining. There should be some interesting developments as these technologies are integrated into new generations of software. Like some of the text analytics tools I’ve found through my research studies (see the next post), it’s best to know how the data is analysed before trusting it, but these tools should at least keep audiences awake during presentations…
Cognitive Edge Ltd. & Cognitive Edge Pte. trading as The Cynefin Company and The Cynefin Centre.
© COPYRIGHT 2025